
OWFR Traffic Analytics
Communications Team Guide
Quick guide for using the Traffic Analytics dashboard on the Ottawa West Four Rivers Ontario Health Team website.
Quick guide for using the Traffic Analytics dashboard on the Ottawa West Four Rivers Ontario Health Team website.
The OWFR Traffic Analytics plugin is a built-in dashboard that shows how visitors are using the OWFR website. It tracks page views, unique visitors, where traffic comes from, and what kinds of devices people are using.
Unlike third-party tools such as Google Analytics, this dashboard lives entirely within your own WordPress site. No data is shared with outside companies, and everything is visible in one place inside your WordPress admin area.
The dashboard is organized from top to bottom in the following order:
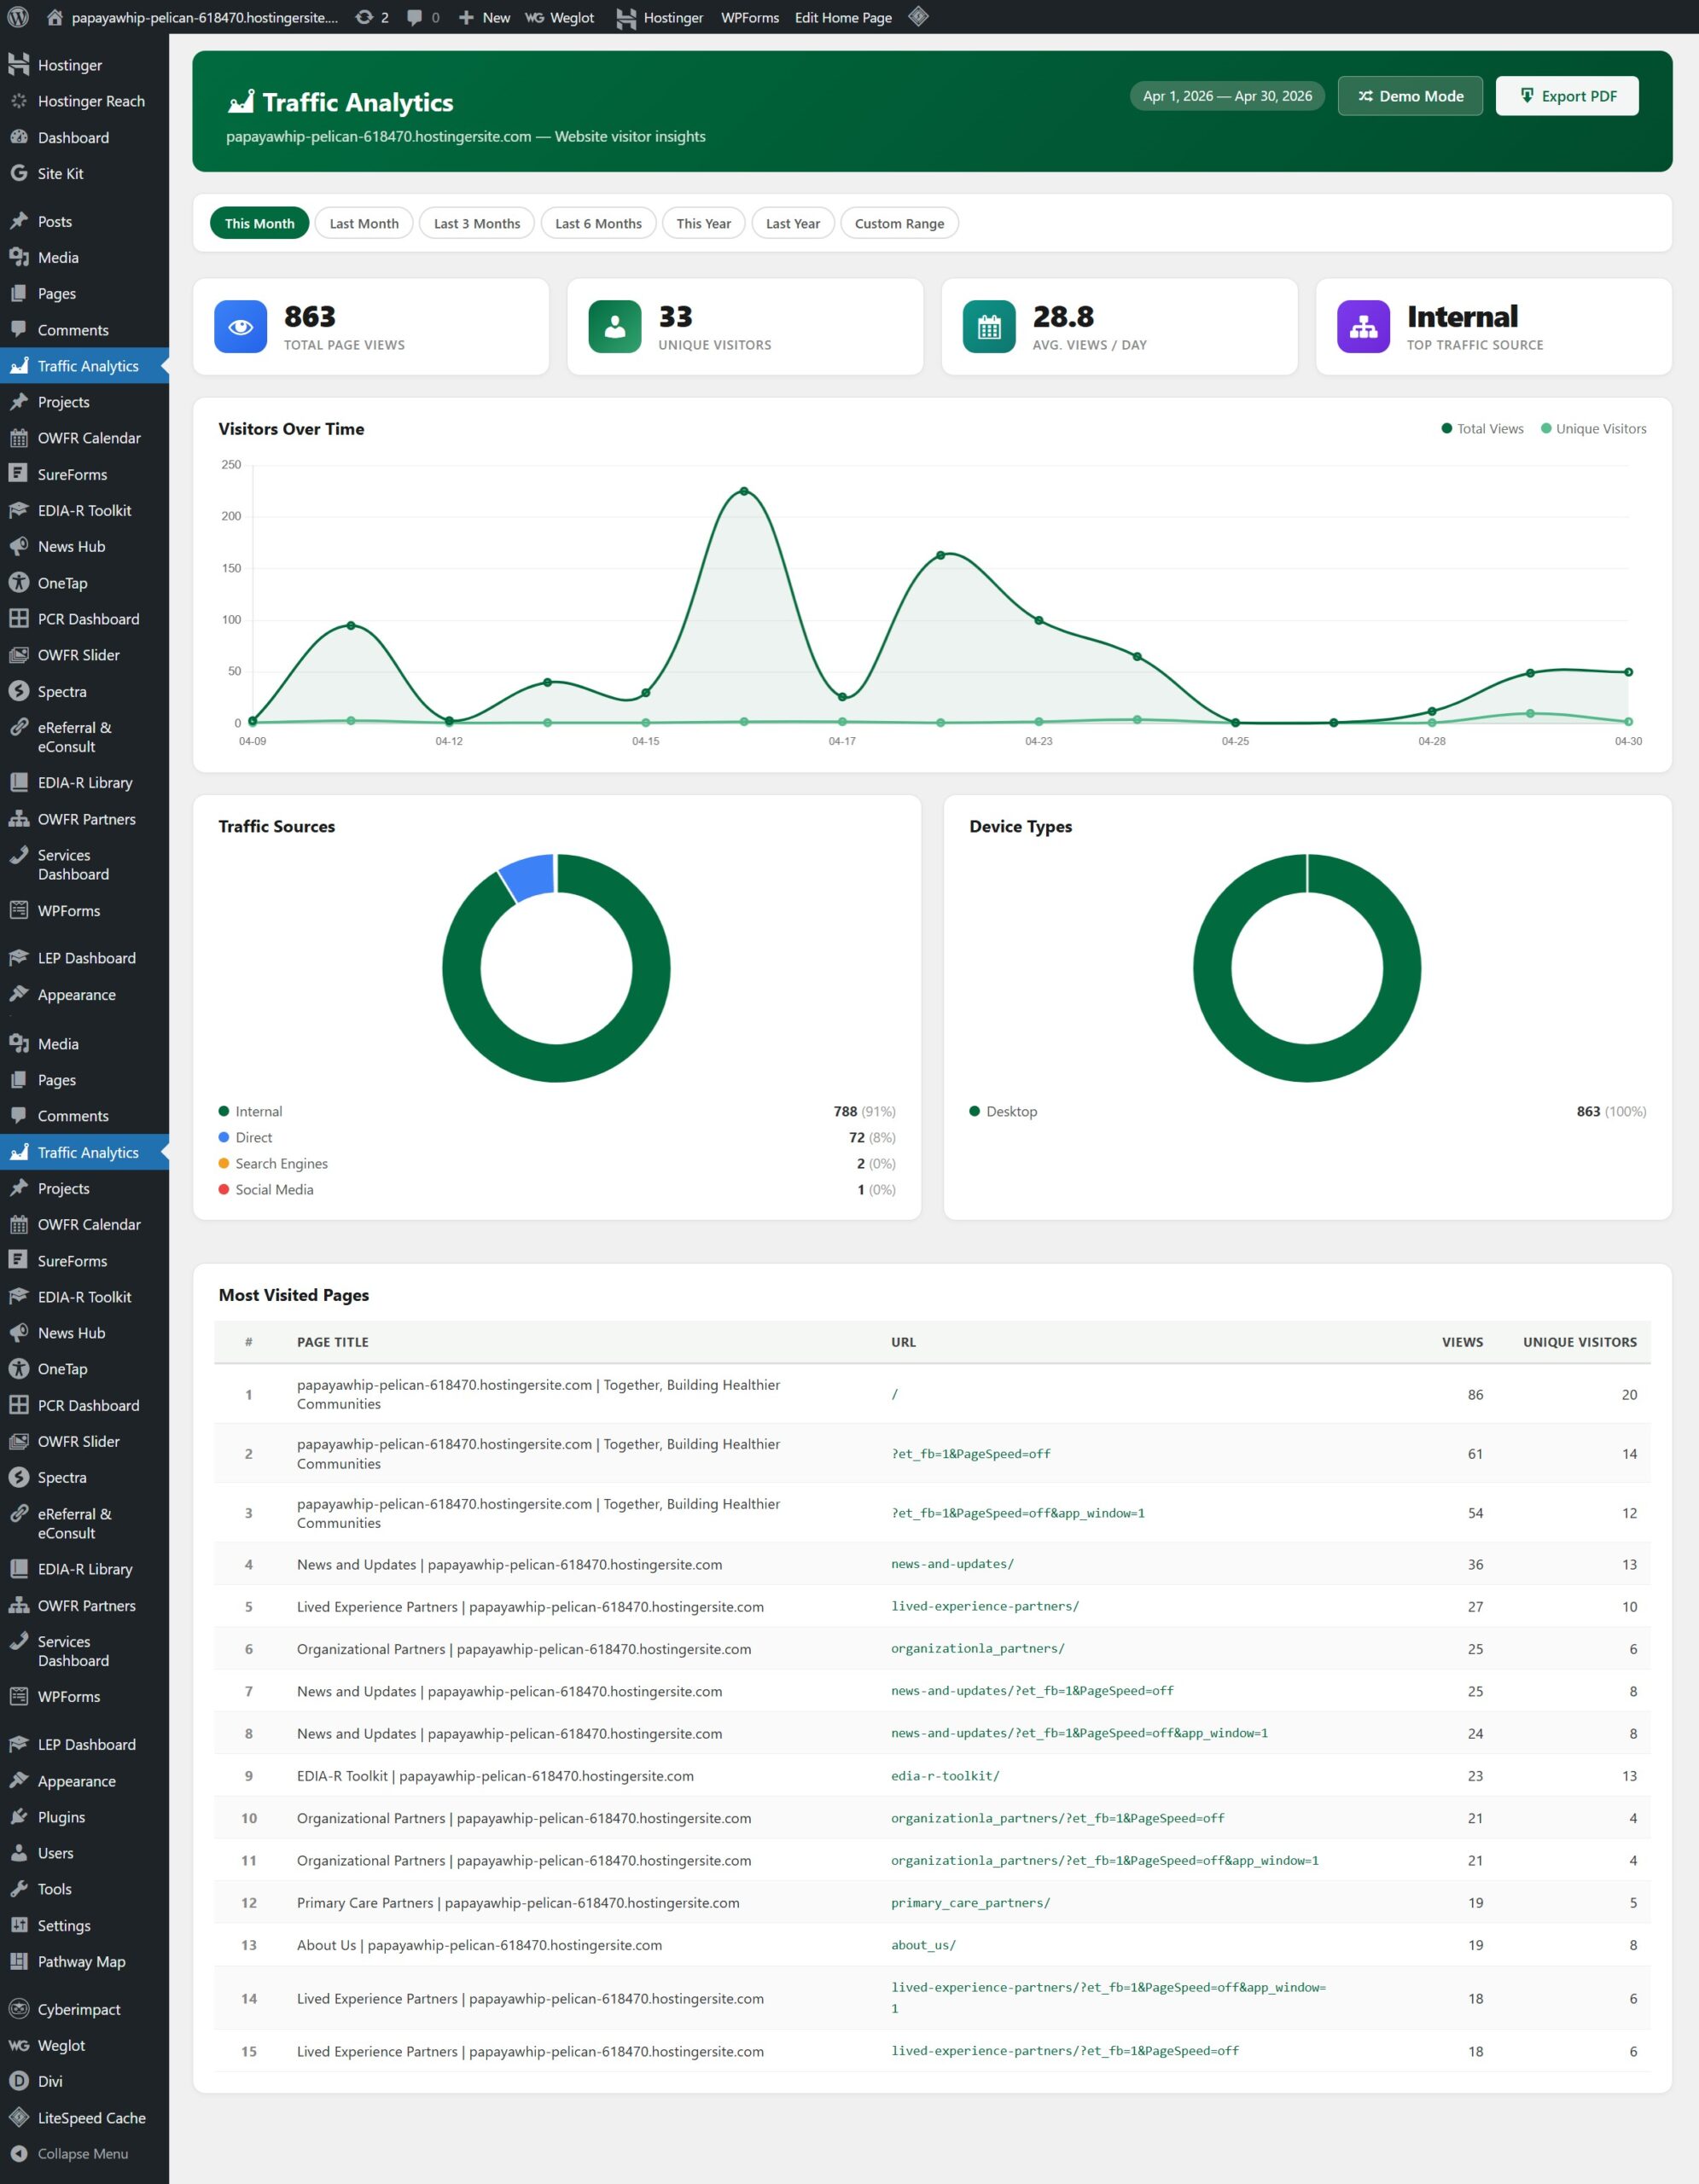
At the top of the main dashboard area, four summary cards give you an instant overview of the selected date period:
| Card | What it means |
|---|---|
| Total Page Views | The total number of times any page on the website was loaded during the selected period. One person visiting five pages counts as five views. |
| Unique Visitors | An estimate of how many different people visited the site. The same person visiting multiple times in a day is counted only once. |
| Avg. Views / Day | The average number of page views per calendar day in the selected period. Useful for comparing activity across periods of different lengths. |
| Top Traffic Source | Which category of source sent the most visitors during the period (e.g. Direct, Organic, Social, Referral). |
The date filter bar sits above the summary cards. All the charts and numbers on the page update automatically when you change the date selection.
| Preset | What it shows |
|---|---|
| This Month | From the 1st of the current month to today. This is the default view when you open the dashboard. |
| Last Month | The full previous calendar month (1st to last day). |
| Last 3 Months | The three most recently completed months plus the current month to date. |
| Last 6 Months | A six-month rolling window, useful for spotting seasonal trends. |
| This Year | January 1st of the current year to today. |
| Last Year | The full previous calendar year (January to December). |
| Custom Range | Opens two date-picker fields so you can specify any exact start and end date. Click Apply to load the data. |
The wide chart across the top of the main area shows daily traffic over the selected period. It has two lines:
Hover your mouse over any point on the chart to see the exact numbers for that day. A spike in the dark green line on a particular day means a large number of page loads occurred; if the light green (unique) line is much lower, it likely means a smaller group of people visited many pages that day.
This chart breaks down where visitors came from. The five possible sources are:
| Source | What it means |
|---|---|
| Direct | The visitor typed the web address directly into their browser, used a bookmark, or opened the link from an app that does not pass referrer information (e.g. many email clients). |
| Organic | The visitor arrived via a search engine result (Google, Bing, DuckDuckGo, Yahoo, etc.). |
| Social | The visitor clicked a link on a social media platform (Facebook, LinkedIn, Twitter/X, Instagram, YouTube, etc.). |
| Referral | The visitor came from a link on another website that is not a search engine or social platform. |
| Internal | The visitor navigated from one page on your own website to another (counted separately from external traffic). |
This chart shows the breakdown of visitor devices:
Hover over any segment to see the exact count and percentage. This information is useful for understanding whether the majority of your audience is reading on a small screen (mobile/tablet) or a larger screen (desktop), which can guide decisions about content layout and image sizes.
The table at the bottom of the dashboard lists the top 15 most-visited pages during the selected period. Each row shows:
| Column | What it shows |
|---|---|
| # | Rank (1 = most visited) |
| Page Title | The title of the page as it appears in the browser tab |
| URL | The full web address of the page |
| Views | Total number of times that page was loaded in the period |
| Unique Visitors | How many different visitors viewed that page |
The dashboard includes a Demo Mode that fills all charts and cards with realistic-looking simulated data. This is useful for:
You can download a PDF snapshot of the current dashboard view to share with your team or include in a report. The PDF captures the summary cards, charts, and top pages table exactly as they appear on screen for the selected date range.
The Traffic Analytics plugin is designed with visitor privacy in mind. Here is how data is handled:
| What is recorded | What is NOT recorded |
|---|---|
| Page URL visited | Visitor name or identity |
| Page title | Email address or login information |
| Referrer website (where they came from) | Exact IP address (only a one-way hash is stored) |
| Traffic source category (Direct, Organic, etc.) | Any form input or personal data entered on the site |
| Device type (Desktop, Mobile, Tablet) | Precise location beyond what device type implies |
| Date and time of visit | Browsing history outside of this website |
The plugin automatically identifies and ignores requests from search engine crawlers and automated bots (such as Googlebot, Bingbot, and similar). This means the view counts reflect genuine human visitors rather than automated traffic.
If the same visitor reloads the same page within five minutes, only the first visit is counted. This prevents a single visitor from inflating the view count by refreshing a page repeatedly.
If you have just installed the plugin, there may not be any recorded traffic yet. The plugin only begins collecting data after it is activated. Check the date filter and make sure the selected period includes dates after the plugin was installed. If the site has been live for a while and data is still missing, contact your website administrator.
The plugin tracks all public page views, including those made by logged-in Administrators when browsing the front end of the site. If you visit the public website while logged in, those visits are counted. To avoid skewing the data, use an incognito/private browser window or a separate browser when testing pages.
Check that the correct date range is selected. Also keep in mind that the plugin filters out bot traffic, which can represent a significant portion of total requests to a website. The figures shown reflect real human visitors only, which is typically a smaller number than raw server log counts.
The dashboard shows the total count of visits from social media sources but does not show which individual social platforms (e.g. Facebook vs. LinkedIn). The source categories are broad: Direct, Organic, Social, Referral, and Internal.
Data is kept indefinitely in the WordPress database unless manually deleted by an Administrator. There is no automatic expiry. If the database grows very large over time, a developer can archive or clear older records.
The Most Visited Pages table shows the top 15 pages for the selected period. More detailed per-page filtering is not available in the current version of the plugin.
It provides a privacy-friendly, self-hosted alternative that covers the most common reporting needs: traffic volume, sources, devices, and top pages. It does not include more advanced features such as goal tracking, funnel analysis, or real-time visitor maps. For high-level communications reporting, the built-in dashboard is fully sufficient.
Reach out to the website administrator or the developer who manages the OWFR website.
OWFR Traffic Analytics Guide | Ottawa West Four Rivers OHT | April 2026